Analytics & Edge Lab
Find the edge hiding in your data.
Analytics is where a journal pays for itself — if the numbers are honest. Sage's analytics read exactly what your journal recorded and follow one rule throughout: counts, not verdicts. Every rate carries its sample size and a confidence interval, a missing value is shown as missing rather than as zero, and nothing tells you a setup "works". The Edge Lab goes further: it re-simulates every trade at fixed targets from the real price path and ranks the conditions that actually carry your edge against your own baseline.
In the app: Analytics · Edge Lab · Reports
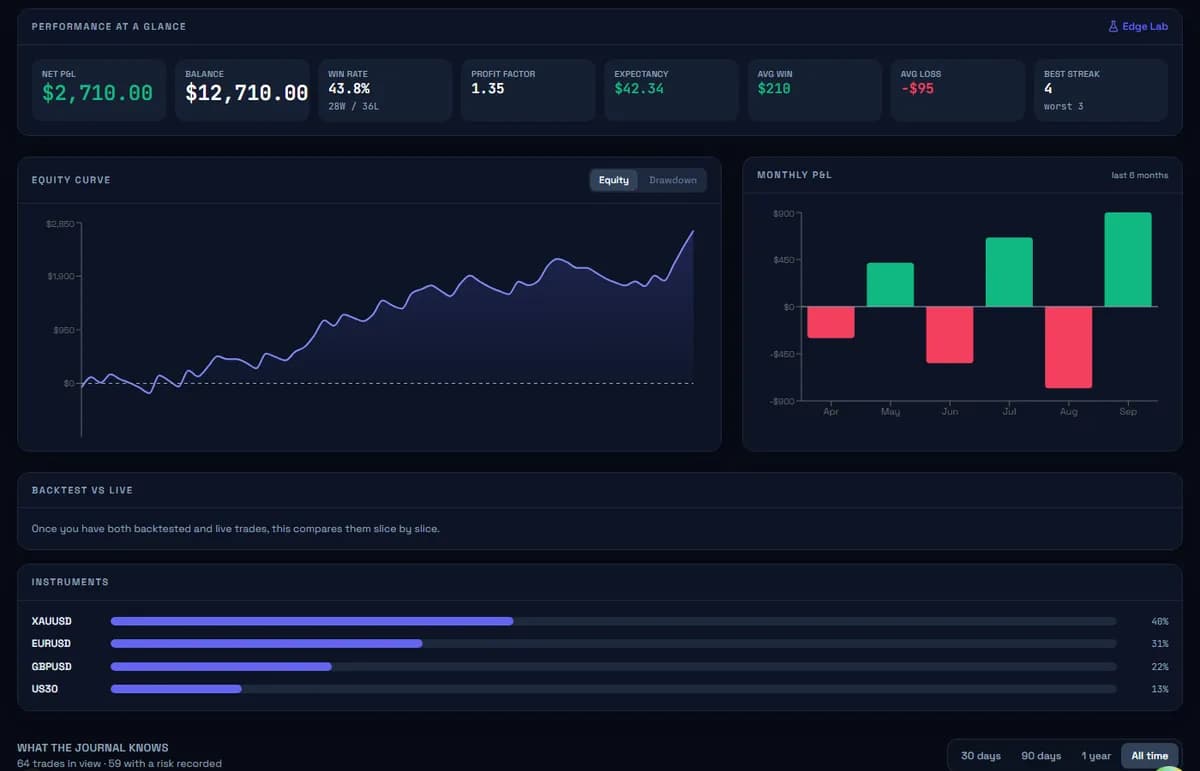
Shown with sample data.
What it is
Trading Analytics & Edge Analysis, concretely.
Honest
Every rate with its interval
Win rates, expectancy and adherence come with n and a 95% Wilson interval. Five trades at 80% is shown as the wide range it is, so a small sample cannot pass for a discovery.
Exact
The R:R simulator
For every trade — live or backtest — walk the real 1-minute path from your entry and race a fixed 1R, 1.5R, 2R, 3R… target against the stop you had at fill, not truncated at where you exited. Win rate, average R, total R, profit factor and drawdown for each target, side by side.
Ranked
Edge by session, setup, tag — and tag pair
Each slice's expectancy as lift over your own baseline, ranked, with sample size. Two conditions together often carry what neither does alone.
Deep
The risk metrics
Sharpe, Sortino, Calmar, SQN, Kelly fraction, runs z-score, consistency score, maximum drawdown — and a Monte Carlo resample of your own trades for drawdown percentiles and probability of ruin at your risk per trade.
Time
Time-of-day and session edge
Which hours and sessions make and lose R, so a leak can be closed by simply not trading it.
Periodic
Reports
A written read of any period — headline, equity, highlights, discipline and behaviour — from the same recorded data, for the weekly review that actually changes the next week.
How it works
How a trader actually uses it.
- 01
Record the stop at fill
Everything here runs in R, and R needs the initial stop. Log it, or let the MetaTrader 5 sync capture it.
- 02
Let the sample build
Around thirty trades the first patterns separate from noise; the intervals tell you when. Backtest sessions build a sample faster and feed the same lab, in their own book.
- 03
Ask the R:R question
Would a fixed target have beaten how you managed the trade? The simulator answers exactly, per target, from the real path — for your live and your backtest trades.
- 04
Rank, then confirm
Sort slices by lift over baseline, discount by sample size, and confirm a candidate on trades it was not found in before you change how you trade. Then write it down as a play.
What it is, and isn't
Straight about the limits.
It does
- ✓Expectancy, win rate, profit factor and drawdown by setup, play, session, hour, day, instrument, tag and tag pair — with n and intervals
- ✓An exact fixed-target R:R simulation from stored 1-minute candles, on live and backtest trades
- ✓Sharpe, Sortino, Calmar, SQN, Kelly, runs z-score, consistency, Monte Carlo drawdown percentiles and ruin probability
- ✓MAE/MFE excursions reconstructed from 1-minute data; time-of-day and session edge; periodic reports
It doesn't
- ✕Supply strategies, setups or signals — the slices are yours, and so is the edge
- ✕Say a setup "works"; it shows the count and the interval
- ✕Show a zero where there is no data; missing is shown as missing
- ✕Compare you to other traders — the baseline is your own record
Trading Analytics & Edge Analysis, answered.
- What is Edge Lab?
- The part of Sage's analytics that hunts for conditions under which your results beat your own baseline: an exact R:R simulator, session/setup/tag ranking by lift, and the risk metrics (Sharpe, Sortino, SQN, Kelly, Monte Carlo). It reads your journal and backtest sessions; it supplies nothing of its own.
- Why do you show confidence intervals?
- Because a win rate from a small sample is mostly noise, and a number without its uncertainty invites a decision the data cannot support. The interval is the honest version of the number.
- How does the R:R simulator work?
- For each trade it takes your entry and the stop you had at fill, walks the real minute-by-minute price path afterwards, and records whether a fixed target or the stop was hit first — for each target level, and past your actual exit. A spread buffer can be applied so a target only counts once price clears it by the spread.
- Does it work on backtest trades?
- Yes — the same simulator and the same metrics run on backtest sessions, in a separate book from your live journal.
- Is analytics free?
- Yes, all of it, with no card required.
Keep going
- FeatureTrading JournalA free online trading journal for forex, gold, indices, futures and crypto. Log trades in seconds or auto-sync from MetaTrader 5, measure everything in R, tag by setup and session, attach screenshots, and see your year on a calendar. Your data stays yours.
- FeatureBacktesting & Market ReplayBacktest a discretionary strategy the honest way: a full TradingView workspace paused at your cursor, no lookahead on any of 16 timeframes, intrabar fills on the historical bid/ask spread, trades you place in the moment, and an exact R:R simulator. Free.
- FeatureRealistic BacktestingBacktest on the bid/ask spread quoted each minute, not one fixed guess: entries, exits, stop losses and take profits fill on the side of the book they trade on.
- FeatureTrading PlaybookA trading playbook where each setup is a written play: thesis, rules, where it applies, how much it risks, and a life from idea to testing to live to retired. Pre-register the idea, link backtests and live trades to it, and see tested-vs-live results with per-rule adherence.
- GuideHow to find your trading edge — in your own trades, not someone else'sAn edge is a condition under which your results beat your own baseline by more than chance explains. How to slice trades by setup, session, tag and time of day, compare against the baseline with confidence intervals, and avoid the traps of small samples and many comparisons.
- GuideTrading statistics that matter — and how each one lies aloneThe handful of numbers that describe a trading record honestly — and how each one lies when read alone. Win rate, expectancy, profit factor, maximum drawdown, Sharpe, Sortino, SQN, Kelly and Monte Carlo, with the sample-size caveat every one of them needs.
- GuideRisk/reward ratio and R-multiples, explainedWhat a risk-to-reward ratio really tells you, how R-multiples make every trade comparable, the break-even win rate for any ratio, and why 'would 3R have paid?' needs the real price path to answer.
See every module on the features overview.
Try trading analytics & edge analysis on your own trades.
Create your workspace in ten seconds. Everything on this page is free, with no card and no paid tier.
Free · no card · your data stays yours